Contents
Data Screening
Load and review the data, check that dates are loaded properly and filter data down to the events in La Palma only. The dataset itself contains all recent IGN earthquake data for Spanish territory.
import pandas as pd
import matplotlib.pyplot as plt
df = pd.read_csv('../data/catalogoComunSV_1663233588717.csv', sep=';')
df.columns = ['Event', 'Date', 'Time', 'Latitude', 'Longitude', 'Depth(km)', 'Intensity','Magnitude', 'Type Mag', 'Location']
df['Time'] = df['Time'].str.strip()
df['Date'] = df['Date'].str.strip()
df['DateTime'] = (df['Date'] + ' ' + df['Time']).apply(pd.to_datetime, format='%d/%m/%Y %H:%M:%S')
df['Timestamp'] = pd.to_numeric(pd.to_datetime(df['DateTime']))
df['Date'] = pd.to_datetime(df['Date'], format="%d/%m/%Y")
df = df.sort_values(by=['DateTime'], ascending=True)
df.head()Loading...
df.describe()Loading...
df.plot.scatter(x="Longitude", y="Latitude", figsize=(12,12), grid="on");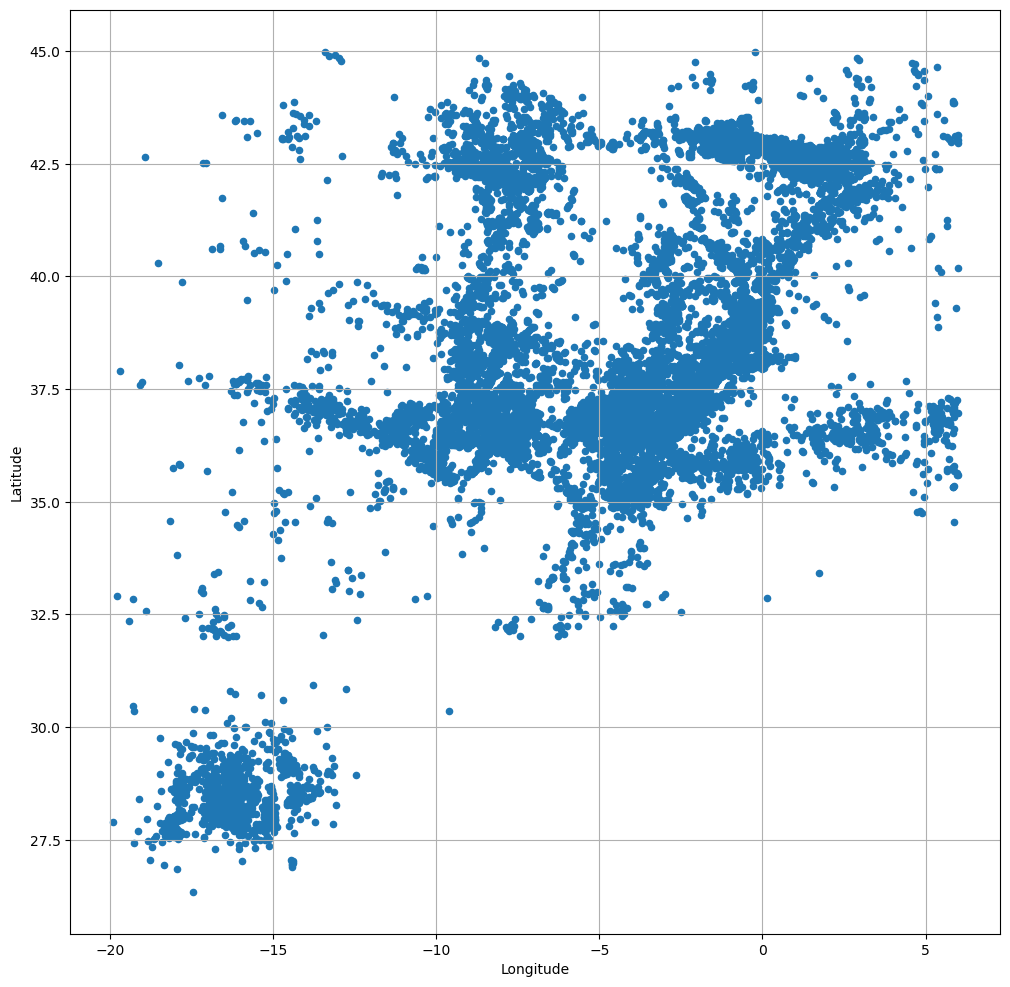
Filter down to La Palma events only
Also some rows seem to be missing depth measurements, (see differences in the count for columns above) - take only rows with valid depths
df = df[(df['Latitude'] < 28.7) & (df['Latitude'] > 28.3) & (df['Longitude'] < -17.7) & (df['Longitude'] > -18)]
df = df[df['Depth(km)'].notna()]
df.describe()
Loading...
plt.figure(figsize=(20,6))
plt.subplot(1,3,1)
df["Latitude"].plot.hist(bins=20, density=True)
df["Latitude"].plot.kde()
plt.subplot(1,3,2)
df["Longitude"].plot.hist(bins=20, density=True)
df["Longitude"].plot.kde()
plt.subplot(1,3,3)
df["Depth(km)"].plot.hist(bins=50, density=True)
_=df["Depth(km)"].plot.kde()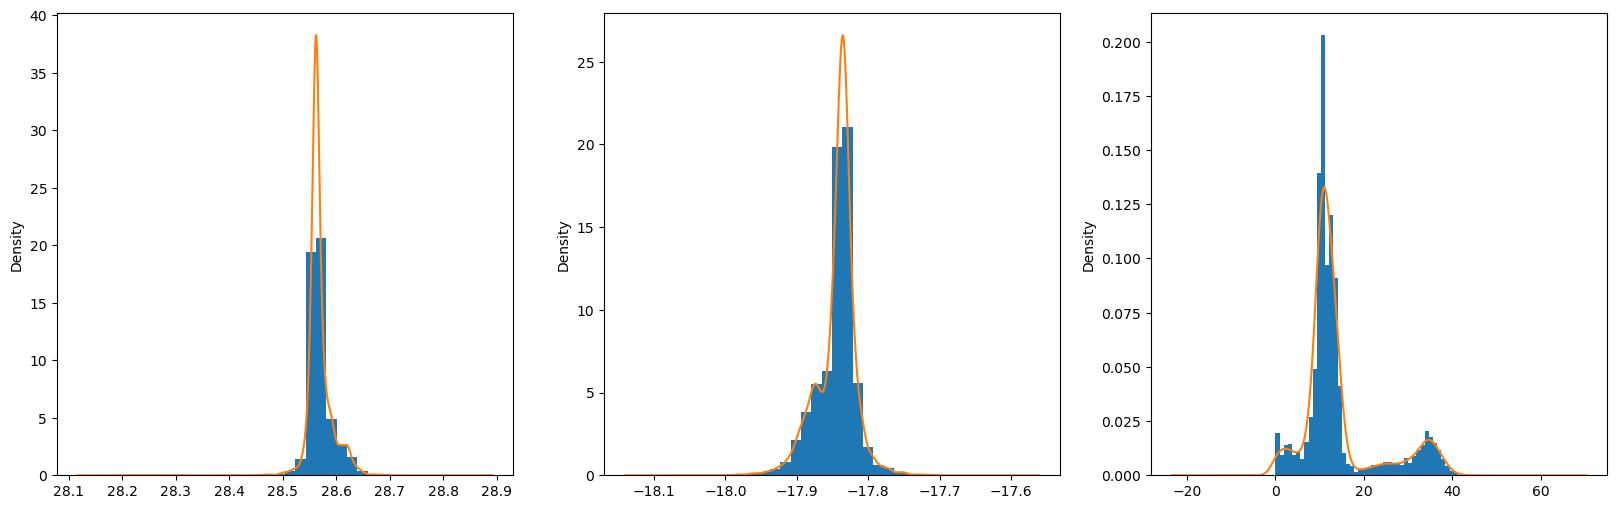
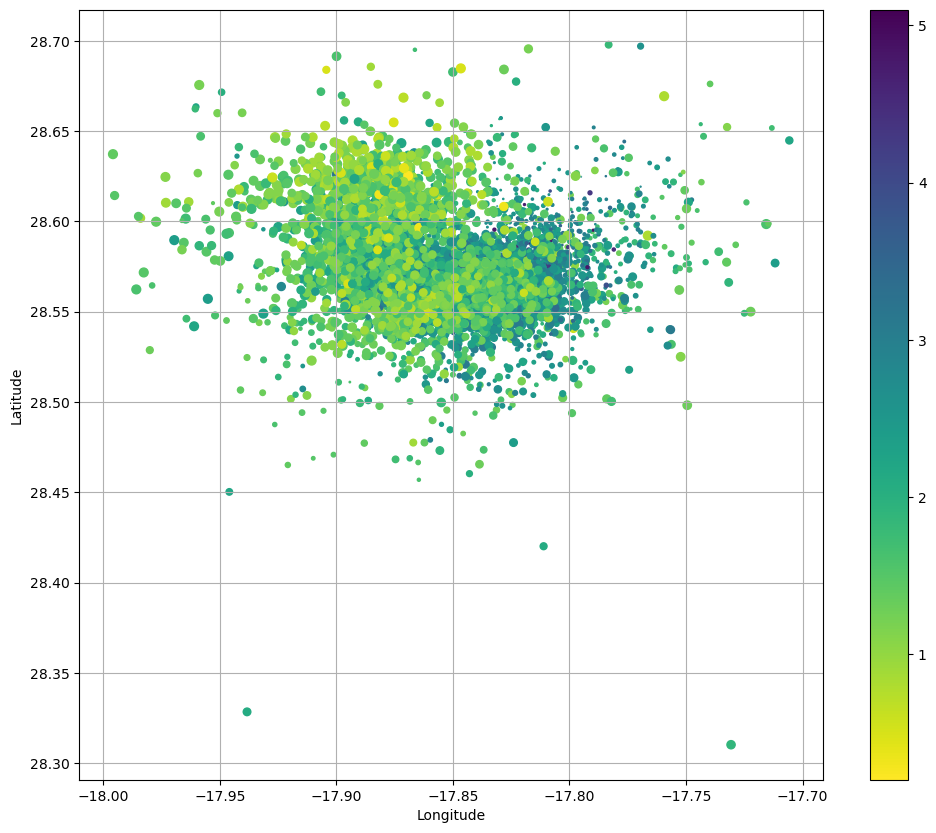
Spatial Plot
Scatter plot the spatial locations of events
from matplotlib import colormaps
cmap = colormaps['viridis_r']
ax = df.plot.scatter(x="Longitude", y="Latitude", s=40-df["Depth(km)"], c=df["Magnitude"], figsize=(12,10), grid="on", cmap=cmap)
/opt/anaconda3/envs/py3/lib/python3.9/site-packages/matplotlib/collections.py:967: RuntimeWarning: invalid value encountered in sqrt
scale = np.sqrt(self._sizes) * dpi / 72.0 * self._factor
Timeline Plot
Scatter plot the event time series and look for any quantization issues. Have times & dates been loaded correctly?
ax = df.plot.scatter(x='DateTime', y='Depth(km)', figsize=(20,8))
ax.set_ylim(50,0);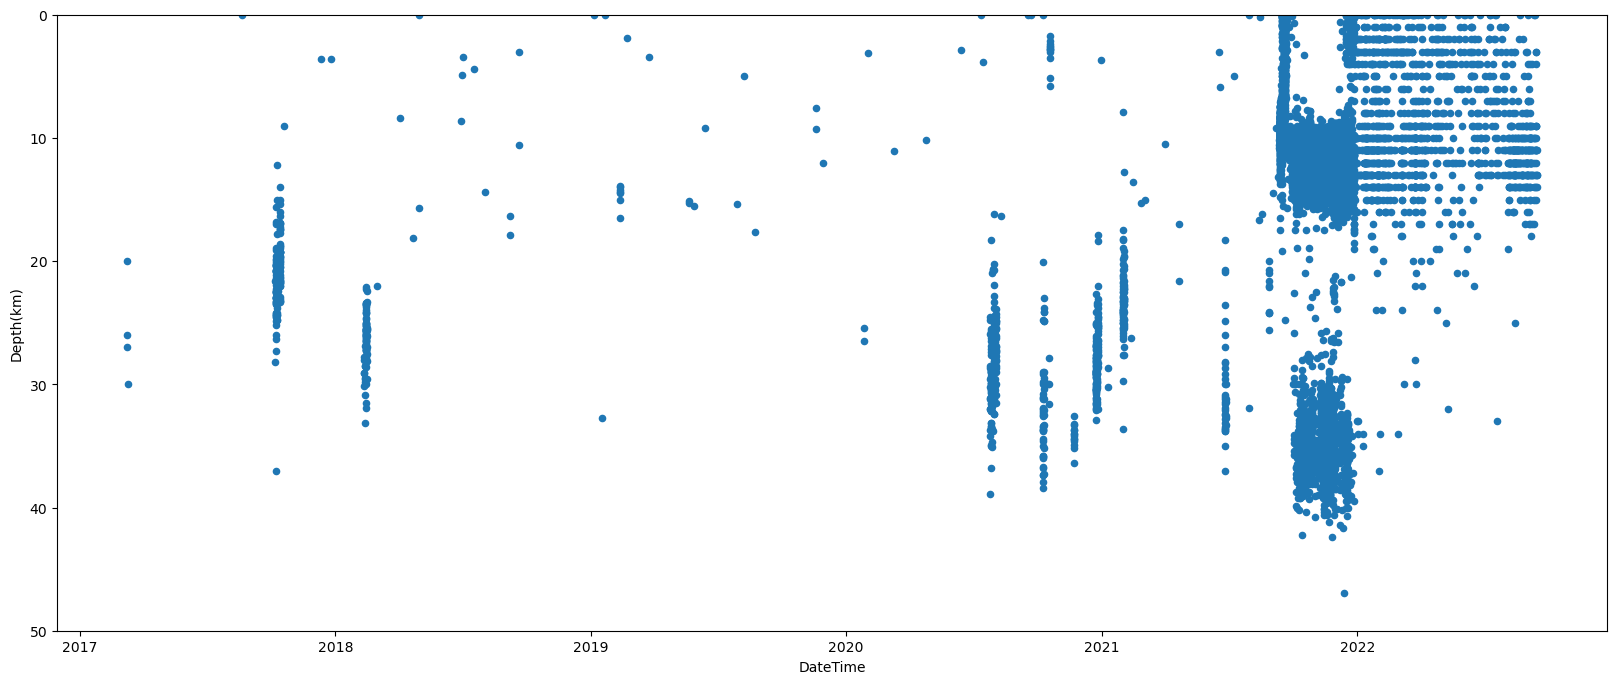
df['Swarm'] = 0
df.loc[(df['Date'] >= '2017-10-01') & (df['Date'] <= '2017-10-31'), 'Swarm'] = 1
df.loc[(df['Date'] >= '2019-02-01') & (df['Date'] <= '2019-02-28'), 'Swarm'] = 2
df.loc[(df['Date'] >= '2020-07-21') & (df['Date'] <= '2020-08-05'), 'Swarm'] = 3
df.loc[(df['Date'] >= '2020-10-04') & (df['Date'] <= '2020-10-10'), 'Swarm'] = 4
df.loc[(df['Date'] >= '2020-10-11') & (df['Date'] <= '2020-10-22'), 'Swarm'] = 5
df.loc[(df['Date'] >= '2020-11-15') & (df['Date'] <= '2020-11-29'), 'Swarm'] = 6
df.loc[(df['Date'] >= '2020-12-10') & (df['Date'] <= '2020-12-29'), 'Swarm'] = 7
df.loc[(df['Date'] >= '2020-12-10') & (df['Date'] <= '2020-12-31'), 'Swarm'] = 8
df.loc[(df['Date'] >= '2021-01-15') & (df['Date'] <= '2021-02-07'), 'Swarm'] = 9
df.loc[(df['Date'] >= '2021-06-01') & (df['Date'] <= '2021-06-30'), 'Swarm'] = 10
df.loc[(df['Date'] >= '2021-07-01'), 'Swarm'] = None


df['Phase'] = 0;
df.loc[(df['Date'] >= '2021-09-11') & (df['Date'] <= '2021-09-30'), 'Phase'] = 1
df.loc[(df['Date'] >= '2021-10-01') & (df['Date'] <= '2021-11-30'), 'Phase'] = 2
df.loc[(df['Date'] >= '2021-12-01') & (df['Date'] <= '2021-12-31'), 'Phase'] = 3
df.loc[(df['Date'] >= '2021-12-31'), 'Phase'] = 4
df.to_csv("../data/lapalma_ign.csv", index=False)