pyUserCalc: A Revised Jupyter Notebook Calculator for Uranium-Series Disequilibria in Basalts
Example: Two Layer Model
1Simple Spreadsheet Calculator
This notebook will demonstrate the use of the twolayermodel convenience function which returns an input dataframe for pyUserCalc consisting of a smoothed two layer model given in the original UserCalc spreadsheet calculator (Spiegelman, 2000)
import pandas as pd
import numpy as np
import matplotlib.pyplot as plt
%matplotlib inline

# Import UserCalc:
import UserCalc
The documentation for this calculator is
UserCalc.twolayermodel?Signature: UserCalc.twolayermodel(P, F, Kr, D_lower, D_upper, N=100, P_lambda=1)
Docstring:
create a pandas dataframe for the UserCalc sample two-layer model defined by a column that spans pressures from
P_bottom to P_top with a possible change in layer properties at pressure P_boundary that is smoothed over a pressure range given by P_lambda
Each layer can have its own bulk partition coefficient D, relative permeability Kr.
The degree of melting is given by a smoothed ramp function defined by three values of F, F(P_bottom), F(P_boundary) and F(P_top)
Parameters:
-----------
P: array [ P_bottom, P_boundary, P_top ]
pressure bounds in the column (assumed kb)
P[0] = P_bottom is the pressure at the bottom of the column
P[1] = P_boundary is the pressure at the layer boundaries
P[2] = P_top is the pressure at the top of the column
F: array [ F_bottom, F_boundary, F_top]
Degree of melting at the bottom, layer boundary and top of the column
D_lower: array [ D_U, D_Th, D_Ra, D_Pa ]
bulk partition coefficients for U-series nuclides in the bottom layer
D_upper: array [ D_U, D_Th, D_Ra, D_Pa ]
bulk partition coefficients for U-series nuclides in the upper layer
Kr: array [ Kr_lower, Kr_upper]
relative permeability of lower and upper layers (controls step function)
N: int
Number of rows in dataframe
P_lambda: float
Pressure smoothing parameter. Controls the width of Smooth steps and ramps between layers (defaults to 1kb)
Returns:
--------
df: pandas dataframe
with columns P, F, Kr, DU, DTh, DRa, DPa
File: ~/dev/curvenote-submit/elkins2021/UserCalc.py
Type: function1.1Example
As an example we will construct a dataframe with rows for a 2 layer model where the lower layer extends from 40-20 Kb, and the upper layer from 20-0 Kb.
The properties of each layer will transition smoothly over a lengthscale of approximately Kb.
# set up input data for two layer model

# Number of rows in the dataframe
N = 41

# Pressure [ Bottom, layer_boundary, Top] in kb
P = [40., 20, 0.]

# Pressure smoothing parameter (in Kb)
P_lambda = 1.
The degree of melting in the lower layer will range linearly from to , and in the upper layer from to
# Degree of melting [Bottom, layer_boundary, Top ]
F = [ 0., 0.05, 0.2]
Each layer can have its own relative permeability and Bulk partition coefficients for , , and
# Relative Permeability of each layer
Kr_lower = 1.
Kr_upper = 1.
Kr = [ Kr_lower, Kr_upper ]

# Bulk partition coefficients for lower and upper layers [DU, DTh, DRa, DPa]
D_lower = [ 0.009, 0.005, 0.0002, 0.0001 ]
D_upper = [ 0.005, 0.004, 0.0002, 0.0001 ]1.1.1Usage:
call the twolayer model with these input values, then print and visualize the output dataframe
df = UserCalc.twolayermodel(P, F, Kr, D_lower, D_upper, N, P_lambda)df.head()fig = UserCalc.plot_inputs(df)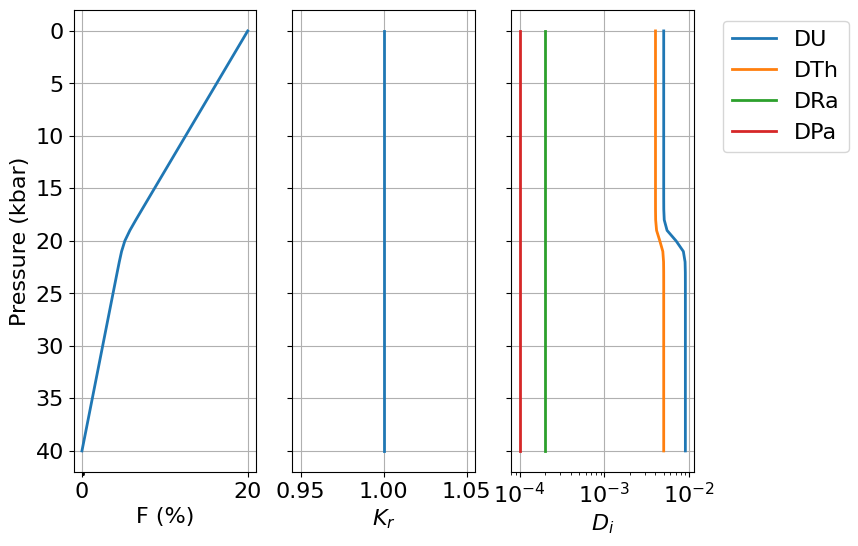
1.2Alternatively save the dataframe as a csv file
df.set_index(['P']).to_csv('data/sample_twolayer_model.csv')