VESIcal: An open-source thermodynamic model engine for mixed volatile (H₂O-CO₂) solubility in silicate melts
Contents
Interactive 1: Dataset preparation
In this notebook, we prepare a dataset with H₂O vs CO₂ contents of multiple samples from one dataset and save this to pickle files for fast access. We here use the dataset of melt inclusions from Cerro Negro volcano in Nicaragua from Roggensack (2001). This will be used to create an interactive version of the plot shown below, this is modeled after Figure 11 in VESIcal Iacovino et al. (2021).

import VESIcal as v
import pickle
import warnings
warnings.filterwarnings('ignore')
myfile = v.BatchFile('cerro_negro.xlsx')1Calculate the isobars and pickle
Uncomment the below to redo the calculation, else use the pickle file loaded in next cell
# Calculate isobars for all samples at 500, 1000, 2000, 3000, and 4000 bars (this will take  while to run...)
isobar_list = []
isopleth_list = []
for index, row in myfile.get_data().iterrows():
    print(row.name)
    isobars, isopleths = v.calculate_isobars_and_isopleths(sample=myfile.get_sample_composition(samplename=row.name, asSampleClass=True),
                                                         temperature=1200,
                                                         pressure_list=[500, 1000, 2000, 3000, 4000],
                                                         print_status=True).result
    isobar_list.append(isobars)
    isopleth_list.append(isopleths) # save this in case  we decide to use it later, since it's calculated anyways


with open('Interaction1_isobars.pickle', 'wb') as handle:
    pickle.dump(isobar_list, handle)

with open('Interaction1_isopleths.pickle', 'wb') as handle:
    pickle.dump(isopleth_list, handle)
# load data from pickled file
file = open('Interaction1_isobars.pickle', 'rb')
isobar_list = pickle.load(file)# add sample names for easier referencing
sample_names = [row.name for index, row in myfile.get_data().iterrows()]
isobar_dict = {}
for count, value in enumerate(isobar_list):
isobar_dict[sample_names[count]] = value2Plot the dataset for verification
#Plot all isobars from dataset
fig, ax = v.plot(isobars=[isobar for isobar in isobar_dict.values()], isobar_labels=sample_names)
v.show()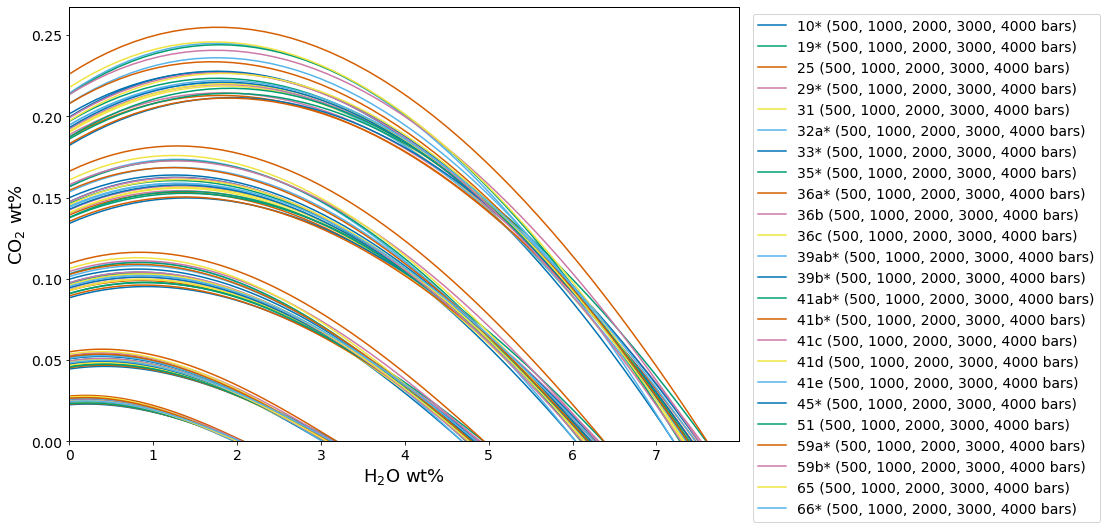
- Roggensack, K. (2001). Unraveling the 1974 eruption of Fuego volcano (Guatemala) with small crystals and their young melt inclusions. Geology, 29, 911–914. https://doi.org/c57htn
- Iacovino, K., Matthews, S., Wieser, P., Moore, G., & Bégué, F. (2021). Jupyter Notebook VESIcal: An open-source thermodynamic model engine for mixed volatile (H2O-CO2) solubility in silicate melts. Zenodo. 10.5281/zenodo.5095409